Self-propulsion and speed prognosis
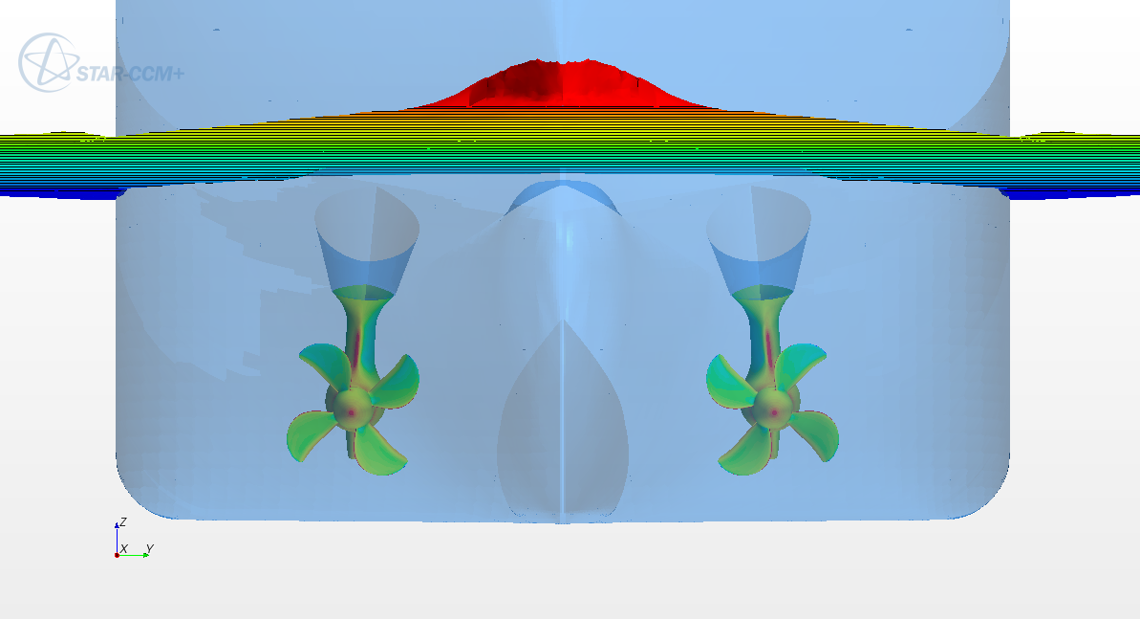
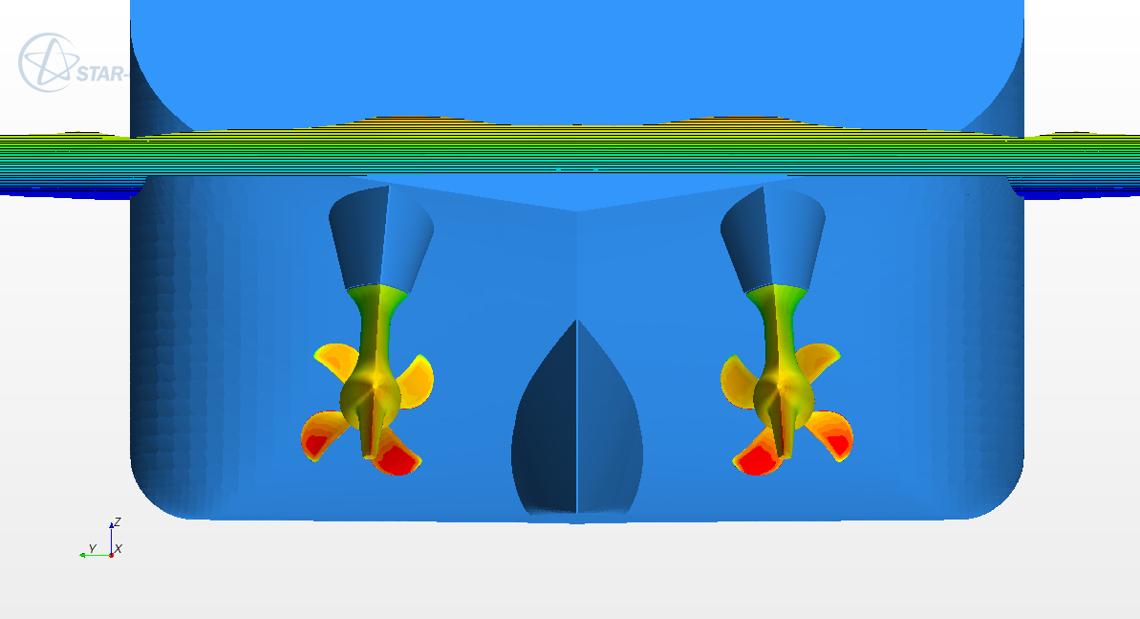
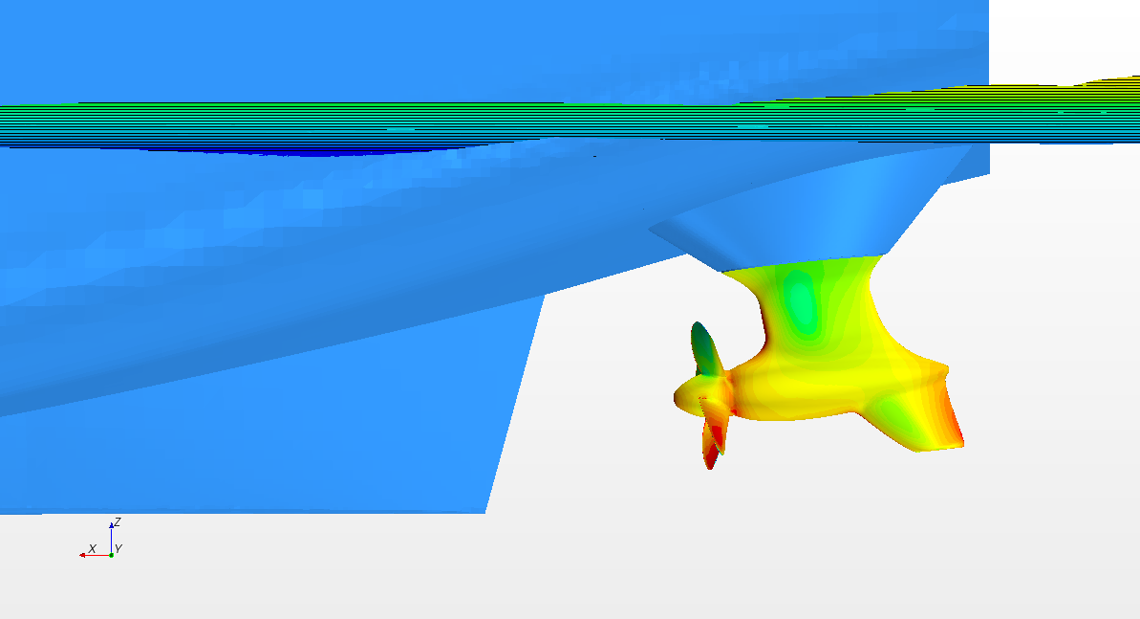
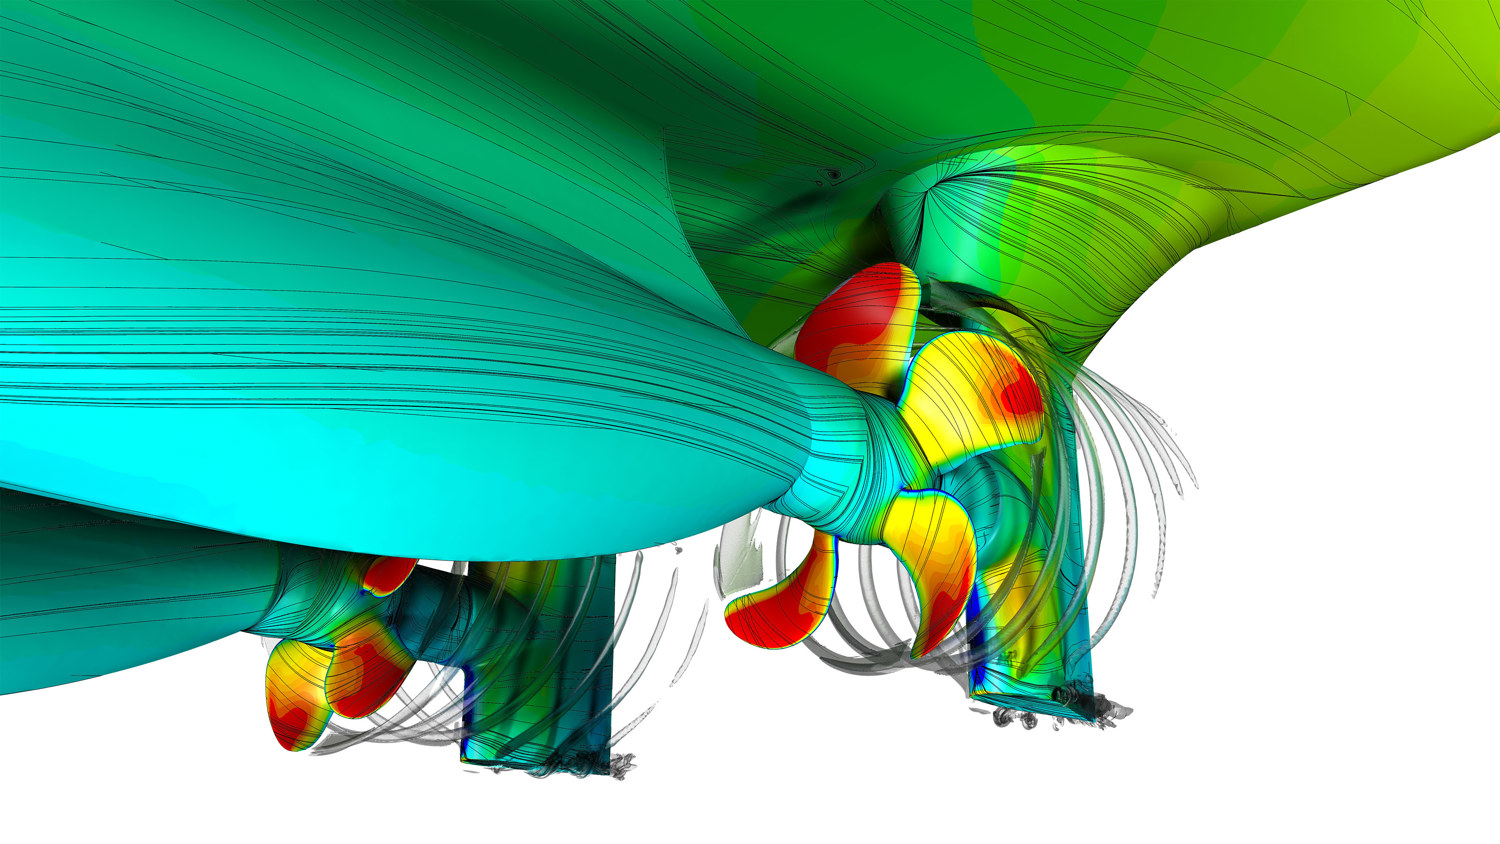
- Self-propulsion simulations using virtual propeller model or sliding mesh technique with the real propeller geometry represented.
- Iterative rpm adjustment to balance propeller thrust and hull resistance.
- Prediction of delivered power to the propeller (PD), propeller shaft speed (n) and propulsor-hull interaction coefficients (wT, t, ηR).
- The hull is free to move in trim and sinkage and the method calculates the free surface and wave resistance using 2-phase (water and air) flow, transient RANS and SST-kΩ turbulence model.
- The simulation can be done with fixed trim and sinkage and without surface waves for quicker relative comparisons.
- As an alternative; analysis and prediction of power consumption and propeller shaft speed can be based on bare hull resistance, empirically determined propulsive coefficients (wT, t, ηR) and open water characteristics from the large database of model tested propellers/thrusters at Kongsberg Maritime's Hydrodynamic Research Centre.
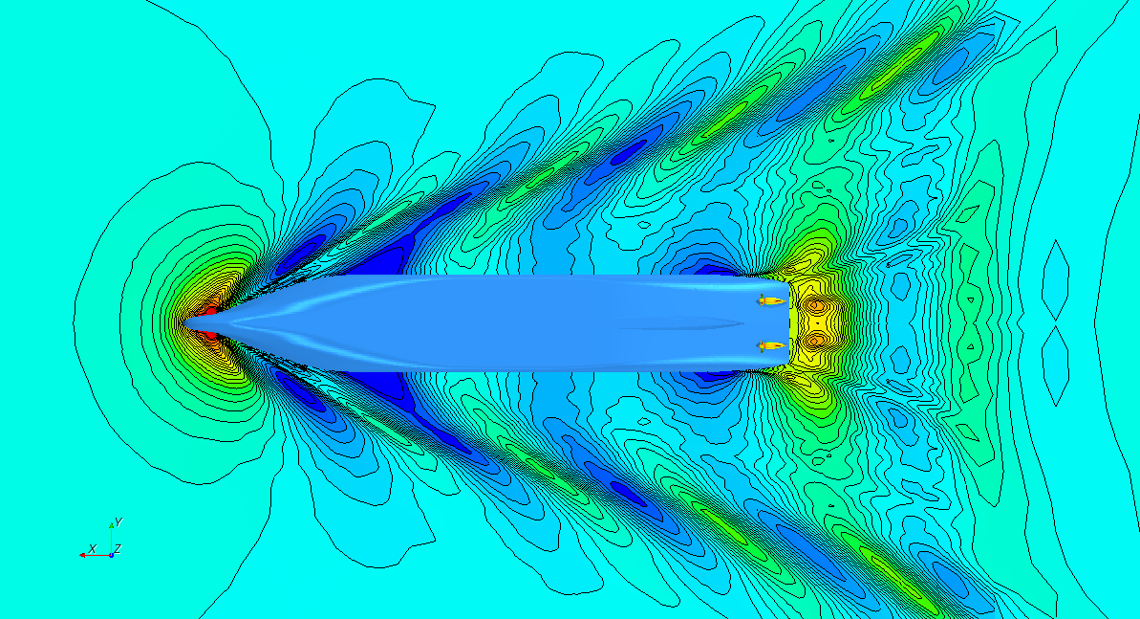
Twin Azipull